pprof的使用

本文基于
Go 1.23写成。Go语言中的pprof指对于指标或特征的分析Profiling,通过分析不仅可以查找到程序中的错误(内存泄漏、race冲突、协程泄漏),也能对程序进行优化(例如CPU利用率不足)。由于Go语言运行时的指标不对外暴露,因此有标准库net/http/pprof和runtime/pprof用于与外界交互。其中net/http/pprof提供了一种通过http访问的便利方式,用于用户调试和获取样本特征数据。对特征文件进行分析要依赖谷歌推出的分析工具pprof ,该工具在Go安装时即存在。
在通过pprof进行特征分析时,需要执行两个步骤:收集样本和分析样本。收集样本有两种方式:一种是引用net/http/pprof并在程序中开启http服务器,net/http/pprof会在初始化init函数时注册路由。
package main

import (
	"log"
	"net/http"
	_ "net/http/pprof"
)

func main() {
	if err := http.ListenAndServe(":8000", nil); err != nil {
		log.Fatal(err)
	}
}通过http收集样本是在实践中最常见的方式,但有时可能不太适合,例如对于一个测试程序或只跑一次的定时任务。
另一种方式是直接在代码中需要分析的位置嵌入分析函数,如下例中调用runtime/pprof的StartCPUProfile函数,这样,在程序调用StopCPUProfile函数停止之后,即可指定特征文件保存的位置。
package main

import (
	"log"
	_ "net/http/pprof"
	"os"
	"runtime/pprof"
)

func main() {
	f, err := os.Create("cpu.pprof")
	if err != nil {
		log.Fatal(err)
	}
	if err := pprof.StartCPUProfile(f); err != nil {
		defer pprof.StopCPUProfile()
	}

	// ...
}当运行程序后,将会生成一个cpu.pprof文件,可以使用以下命令分析数据:
$ go tool pprof cpu.pprof本文将主要介绍通过http获取文件的方式为例进行分析。Go语言提供了多种特征分析手段,如下所示,获取不同类型的特征文件需要调用不同的http接口,例如要获取程序在15s内占用CPU的情况:
$ go tool pprof http://127.0.0.1:8000/debug/pprof/profile?seconds=15获取所有的协程堆栈信息:
$ go tool pprof http://127.0.0.1:8000/debug/pprof/goroutine获取堆内存使用情况:
$ go tool pprof http://127.0.0.1:8000/debug/pprof/heap其他特征文件的获取方式以此类推。
其中,cmdline类型请求比较特殊,它仅打印程序启动时的启动参数,例如./main,并不会生成特征文件。而获取内存对象分配的alloc类型可以在分析时直接通过heap类型的分析间接获取特征文件,因此在实践中大多选择使用heap来分析。block、threadcreate、mutex这三种类型在实践中很少使用,一般用于特定的场景分析。最常用的4种pprof类型包括了堆分析heap、协程栈分析goroutine、CPU占用分析profile、程序运行跟踪信息trace,接下来我们将逐一分析。
堆内存特征分析
当执行pprof分析堆内存的特征文件时,默认的类型为inuse_space,代表分析程序正在使用的内存,最后一行会出现等待进行交互的命令:
package main

import (
	"log"
	"net/http"
	_ "net/http/pprof"
	"os"
	"time"
)

type run struct {
	slice  []byte
	slice2 []byte
}

func (r *run) Run1() {
	r.slice = make([]byte, 8*1024*1024)
	r.Run2()
}

func (r *run) Run2() {
	r.slice = make([]byte, 8*1024*1024)
}

func main() {
	go func() {
		if err := http.ListenAndServe(":8000", nil); err != nil {
			log.Fatal(err)
		}
		os.Exit(0)
	}()

	r := &run{}
	go func() {
		for {
			time.Sleep(100 * time.Millisecond)
			r.Run1()
		}
	}()
	time.Sleep(100 * time.Minute)
}执行pprof分析堆内存:
$ go tool pprof http://127.0.0.1:8000/debug/pprof/heap
Fetching profile over HTTP from http://127.0.0.1:8000/debug/pprof/heap
Saved profile in C:\Users\Admin\pprof\pprof.___go_build_examples_learnpprof.exe.alloc_objects.alloc_space.inuse_objects.inuse_space.011.pb.gz
File: ___go_build_examples_learnpprof.exe
Build ID: C:\Users\Admin\AppData\Local\JetBrains\GoLand2024.2\tmp\GoLand\___go_build_examples_learnpprof.exe2024-09-26 17:15:43.9546594 +0800 CST
Type: inuse_space
Time: Sep 26, 2024 at 5:15pm (CST)
Entering interactive mode (type "help" for commands, "o" for options)
(pprof) top交互命令有许多,可以通过help指令查看,接下来介绍比较常用的几种。top会列出以flat列从大到小排序的序列。其中flat代表当前函数统计的值,不同的类型有不同的含义。这里是heap inuse_space模式,展示了当前函数分配的堆区正在使用的内存大小。cum是一个累积的概念,指当前函数及其调用的一系列函数flat的和。flat只包含当前函数的栈帧信息,不包括其调用函数的栈帧信息。cum字段正好弥补了这一点,flat%和cum%分别表示flat和cum字段占总字段的百分比。
从输出的信息中可以看到,Run1函数被分配了8MB内存,Run2函数也被分配了8MB内存:
(pprof) top
Showing nodes accounting for 16MB, 100% of 16MB total
      flat  flat%   sum%        cum   cum%
       8MB 50.00% 50.00%       16MB   100%  main.(*run).Run1 (inline)
       8MB 50.00%   100%        8MB 50.00%  main.(*run).Run2 (inline)
0 0% 100% 16MB 100% main.main.func2如果要根据cum进行排序,那么可以使用top -cum命令,从中可以看出差别,Run1函数的cum为16MB,Run2函数的cum为8MB:
(pprof) top -cum
Showing nodes accounting for 16MB, 100% of 16MB total
      flat  flat%   sum%        cum   cum%
       8MB 50.00% 50.00%       16MB   100%  main.(*run).Run1 (inline)
         0     0% 50.00%       16MB   100%  main.main.func2
8MB 50.00% 100% 8MB 50.00% main.(*run).Run2 (inline)可以使用list Run列出函数的信息,从中可以看出,虽然Run1与Run2函数都被分配了8MB内存,但是由于Run1函数调用了Run2函数,因此在统计cum时,Run1函数的内存还包括其调用的子函数的内存。这种方式精准地显示了具体的内存分配发生在哪一行:
(pprof) list Run
Total: 16MB
ROUTINE ======================== main.(*run).Run1 in D:\goworkspace\examples\learnpprof\main.go
       8MB       16MB (flat, cum)   100% of Total
         .          .     16:func (r *run) Run1() {
       8MB        8MB     17:   r.slice = make([]byte, 8*1024*1024)
         .        8MB     18:   r.Run2()
         .          .     19:}
         .          .     20:
         .          .     21:func (r *run) Run2() {
         .          .     22:   r.slice = make([]byte, 8*1024*1024)
         .          .     23:}
ROUTINE ======================== main.(*run).Run2 in D:\goworkspace\examples\learnpprof\main.go
       8MB        8MB (flat, cum) 50.00% of Total
         .          .     21:func (r *run) Run2() {
       8MB        8MB     22:   r.slice = make([]byte, 8*1024*1024)
         .          .     23:}
         .          .     24:
         .          .     25:func main() {
         .          .     26:   go func() {
. . 27: if err := http.ListenAndServe(":8000", nil); err != nil {也可以使用tree命令打印函数的调用链,能够得到函数调用的堆栈信息:
(pprof) tree
Showing nodes accounting for 16MB, 100% of 16MB total
----------------------------------------------------------+-------------
      flat  flat%   sum%        cum   cum%   calls calls% + context
----------------------------------------------------------+-------------
                                              16MB   100% |   main.main.func2 (inline)
       8MB 50.00% 50.00%       16MB   100%                | main.(*run).Run1
                                               8MB 50.00% |   main.(*run).Run2 (inline)
----------------------------------------------------------+-------------
                                               8MB   100% |   main.(*run).Run1 (inline)
       8MB 50.00%   100%        8MB 50.00%                | main.(*run).Run2
----------------------------------------------------------+-------------
         0     0%   100%       16MB   100%                | main.main.func2
                                              16MB   100% |   main.(*run).Run1 (inline)
----------------------------------------------------------+-------------在heap中,可以显示4种不同的类型,分别是alloc_objects、alloc_space、inuse_objects、inuse_space,其中alloc_objects与inuse_objects分别代表已经被分配的对象和正在使用的对象的数量,alloc_objects没有考虑对象的释放情况。要切换展示的类型很简单,只需要输入对应的指令即可,例如输入alloc_objects后再次输入top指令会看到flat代表的不再是分配的内存大小,而是分配内存的次数:
(pprof) alloc_objects
(pprof) top
Showing nodes accounting for 37, 100% of 37 total
      flat  flat%   sum%        cum   cum%
        19 51.35% 51.35%         37   100%  main.(*run).Run1 (inline)
        18 48.65%   100%         18 48.65%  main.(*run).Run2 (inline)
0 0% 100% 37 100% main.main.func2pprof工具还提供了强大的可视化功能,可以生成便于查看的图片或html文件。但实现这种功能需要首先安装graphviz——开源的可视化工具,可以在官方网站找到最新的下载方式,安装完成后,输入web即可在浏览器中显示如下图所示内存分配次数的可视化结果。png、gif等指令可以将可视化结果保存为不同的图片格式:

从图中能够直观地看出当前函数的调用链及内存分配数量和比例,从而找出程序中内存分配的关键部分。
pprof可视化结果说明
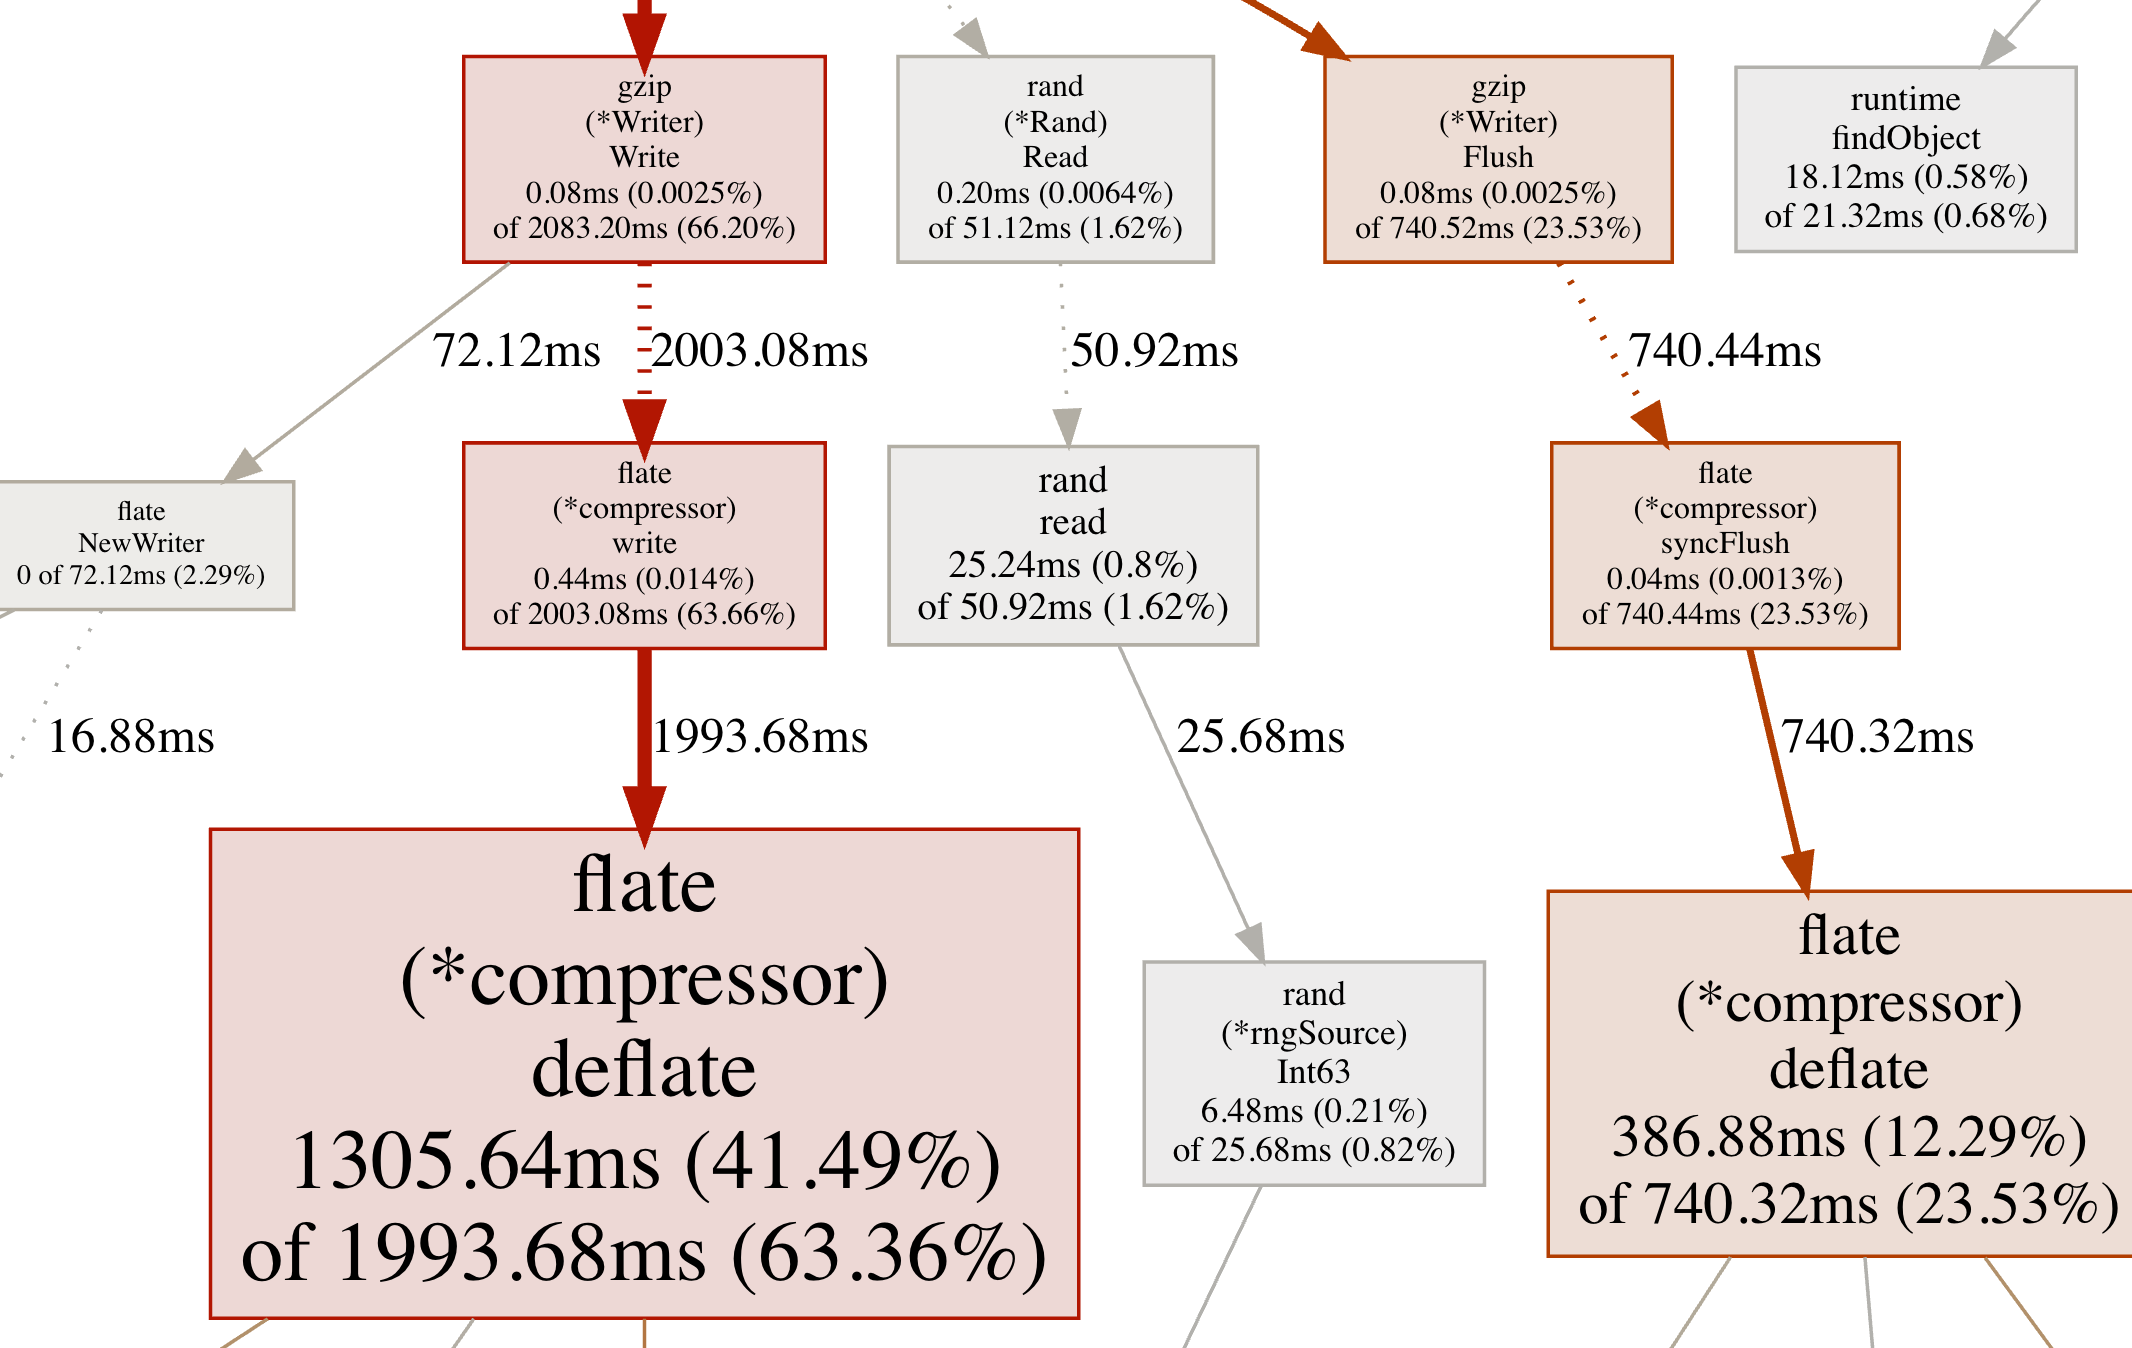
节点颜色
红色代表累计值cum为正,并且很大;
绿色代表累计值cum为负,并且很大;
灰色代表累计值cum可以忽略不计。
节点字体大小
较大的字体表示较大的当前值;
较小的字体表示较小的当前值。
边框颜色
当前值较大并且为正数时为红色;
当前值较小并且为负数时为绿色;
接近0的当前值为灰色。
箭头大小
箭头越粗代表当前的路径消耗了越多的资源;
箭头越细代表当前的路径消耗了越少的资源。
箭头类型
虚线箭头表示两个节点之间的某些节点已被忽略,为间接调用;
实线箭头表示两个节点之间为直接调用。
pprof协程栈分析
除了堆内存分析,协程栈使用得也比较多。分析协程栈有两方面的作用,一是查看协程的数量,查看协程是否泄漏。二是查看当前大量的协程在执行哪些函数,判断当前协程是否健康。
package main

import (
	"log"
	"net/http"
	_ "net/http/pprof"
	"os"
	"time"
)

func example1() {
	a := make(chan int)
	for {
		time.Sleep(time.Second)
		go func() {
			<-a
		}()
	}
}
func example2() {
	for {
		time.Sleep(1 * time.Second)
		go loop()
	}
}

func loop() {
	i := 0
	for {
		i++
	}
}

func main() {
	go func() {
		if err := http.ListenAndServe(":8000", nil); err != nil {
			log.Fatal(err)
		}
		os.Exit(0)
	}()
	example2()
	time.Sleep(5 * time.Minute)
}使用pprof工具查看程序运行信息如下所示。可以看出,当前收集到的协程数量有52个,并且大部分协程都在runtime.gopark函数中:
$ go tool pprof http://127.0.0.1:8000/debug/pprof/goroutine
Fetching profile over HTTP from http://127.0.0.1:8000/debug/pprof/goroutine
...
Entering interactive mode (type "help" for commands, "o" for options)
(pprof) top
Showing nodes accounting for 51, 98.08% of 52 total
Showing top 10 nodes out of 32
      flat  flat%   sum%        cum   cum%
        48 92.31% 92.31%         48 92.31%  runtime.asyncPreempt2
         2  3.85% 96.15%          2  3.85%  runtime.gopark
         1  1.92% 98.08%          1  1.92%  runtime.goroutineProfileWithLabels
         0     0% 98.08%          1  1.92%  internal/poll.(*FD).Accept
         0     0% 98.08%          1  1.92%  internal/poll.(*FD).acceptOne
         0     0% 98.08%          1  1.92%  internal/poll.(*pollDesc).wait
         0     0% 98.08%          1  1.92%  internal/poll.execIO
         0     0% 98.08%          1  1.92%  internal/poll.runtime_pollWait
         0     0% 98.08%          1  1.92%  main.example2
0 0% 98.08% 48 92.31% main.loopruntime.gopark是协程的休眠函数,要进一步查看程序是否异常可以使用list指令或者tree指令。
如下通过tree指令查找到函数的调用链,发现协程堵塞是调用了runtime.chanrecv函数以表明通道正在等待接收导致的。具体的原因还需要结合程序进一步分析:
(pprof) tree
Showing nodes accounting for 51, 98.08% of 52 total
----------------------------------------------------------+-------------
      flat  flat%   sum%        cum   cum%   calls calls% + context
----------------------------------------------------------+-------------
                                                48   100% |   runtime.asyncPreempt
        48 92.31% 92.31%         48 92.31%                | runtime.asyncPreempt2
----------------------------------------------------------+-------------
                                                 1 50.00% |   runtime.netpollblock
                                                 1 50.00% |   time.Sleep
         2  3.85% 96.15%          2  3.85%                | runtime.gopark
----------------------------------------------------------+-------------
                                                 1   100% |   runtime.pprof_goroutineProfileWithLabels
         1  1.92% 98.08%          1  1.92%                | runtime.goroutineProfileWithLabels
----------------------------------------------------------+-------------
                                                 1   100% |   net.(*netFD).accept
         0     0% 98.08%          1  1.92%                | internal/poll.(*FD).Accept
                                                 1   100% |   internal/poll.(*FD).acceptOne
...
base基准分析
除了查看协程栈帧数据,goroutine profile还有一个用处是排查协程的泄露。通过对比协程的总数可以简单评估出程序是否陷入了泄露状态。另外,pprof提供了更强大的工具用于对比前后特征文件的不同。
$ go tool pprof -base pprof.___1go_build_examples_learnpprof.exe.goroutine.001.pb.gz pprof.___1go_build_examples_learnpprof.exe.goroutine.002.pb.gz
File: ___1go_build_examples_learnpprof.exe
Build ID: C:\Users\Admin\AppData\Local\JetBrains\GoLand2024.2\tmp\GoLand\___1go_build_examples_learnpprof.exe2024-09-27 10:49:20.3869625 +0800 CST
Type: goroutine
Time: Sep 27, 2024 at 10:49am (CST)
Entering interactive mode (type "help" for commands, "o" for options)
(pprof) top
Showing nodes accounting for 6, 66.67% of 9 total
Showing top 10 nodes out of 12
      flat  flat%   sum%        cum   cum%
         7 77.78% 77.78%          7 77.78%  runtime.asyncPreempt2
        -1 11.11% 66.67%         -1 11.11%  runtime.gopark
         0     0% 66.67%         -1 11.11%  internal/poll.(*FD).Read
         0     0% 66.67%         -1 11.11%  internal/poll.(*pollDesc).wait
         0     0% 66.67%         -1 11.11%  internal/poll.execIO
         0     0% 66.67%         -1 11.11%  internal/poll.runtime_pollWait
         0     0% 66.67%          7 77.78%  main.loop
         0     0% 66.67%         -1 11.11%  net.(*conn).Read
         0     0% 66.67%         -1 11.11%  net.(*netFD).Read
0 0% 66.67% -1 11.11% net/http.(*connReader).backgroundRead下例使用了-base标志,后跟基准特征文件。可以看出,后一个基准特征文件比前一个基准特征文件多了9个协程,其中12个协程都处于执行runtime.gopark阶段,可以根据实际的程序判断协程是否已经泄漏。
mutex堵塞分析
和block类似,mutex主要用于查看锁争用导致的休眠时间,这有助于排查由于锁争用导致CPU利用率不足的问题,这两种特征不经常被使用。
package main

import (
	"log"
	"net/http"
	_ "net/http/pprof"
	"os"
	"runtime"
	"sync"
	"time"
)

func main() {
	go func() {
		if err := http.ListenAndServe(":8000", nil); err != nil {
			log.Fatal(err)
		}
		os.Exit(0)
	}()
	var mu sync.Mutex
	var items = make(map[int]struct{})

	runtime.SetMutexProfileFraction(5)
	for i := 0; i < 1000*1000; i++ {
		go func(i int) {
			mu.Lock()
			defer mu.Unlock()
			items[i] = struct{}{}
		}(i)
	}

	time.Sleep(1 * time.Minute)
}执行pprof mutex可以看到,锁争用集中在互斥锁中,互斥带来的休眠时间为5.36hrs,需要结合实际程序判断锁争用是否导致了CPU利用率不足:
$ go tool pprof http://127.0.0.1:8000/debug/pprof/mutex
Fetching profile over HTTP from http://127.0.0.1:8000/debug/pprof/mutex
Saved profile in C:\Users\Admin\pprof\pprof.___1go_build_examples_learnpprof.exe.contentions.delay.001.pb.gz
File: ___1go_build_examples_learnpprof.exe
Build ID: C:\Users\Admin\AppData\Local\JetBrains\GoLand2024.2\tmp\GoLand\___1go_build_examples_learnpprof.exe2024-09-27 14:30:05.1108947 +0800 CST
Type: delay
Time: Sep 27, 2024 at 2:30pm (CST)
Entering interactive mode (type "help" for commands, "o" for options)
(pprof) top
Showing nodes accounting for 5.36hrs, 100% of 5.36hrs total
Dropped 1 node (cum <= 0.03hrs)
      flat  flat%   sum%        cum   cum%
   5.36hrs   100%   100%    5.36hrs   100%  sync.(*Mutex).Unlock
         0     0%   100%    5.36hrs   100%  main.main.func2
         0     0%   100%    5.36hrs   100%  main.main.gowrap1
CPU占用分析
在实践中我们经常使用pprof分析CPU占用,它提供了强有力的工具,在不破坏原始程序的情况下,估计出函数的执行时间,从而找出程序的瓶颈。
执行如下指令进行CPU占用分析,其中seconds参数指定一共要分析的时间。下例表明将花费20s收集特征信息。
package main

import (
	"net/http"
	_ "net/http/pprof"
)

func main() {
	http.HandleFunc("/loop", loop)
	http.ListenAndServe(":8000", nil)
}

func loop(writer http.ResponseWriter, request *http.Request) {
	i := 0
	for {
		i++
	}
}执行CPU占用分析,分析结果如下:
$ go tool pprof http://127.0.0.1:8000/debug/pprof/profile?seconds=30
Fetching profile over HTTP from http://127.0.0.1:8000/debug/pprof/profile?seconds=30
Saved profile in C:\Users\Admin\pprof\pprof.___1go_build_examples_learnpprof.exe.samples.cpu.007.pb.gz
File: ___1go_build_examples_learnpprof.exe
Build ID: C:\Users\Admin\AppData\Local\JetBrains\GoLand2024.2\tmp\GoLand\___1go_build_examples_learnpprof.exe2024-09-27 15:09:18.7264393 +0800 CST
Type: cpu
Time: Sep 27, 2024 at 3:09pm (CST)
Duration: 30.11s, Total samples = 28.05s (93.15%)
Entering interactive mode (type "help" for commands, "o" for options)
(pprof) top
Showing nodes accounting for 27.99s, 99.79% of 28.05s total
Dropped 7 nodes (cum <= 0.14s)
      flat  flat%   sum%        cum   cum%
    27.99s 99.79% 99.79%     28.03s 99.93%  main.loop
         0     0% 99.79%     28.03s 99.93%  net/http.(*ServeMux).ServeHTTP
         0     0% 99.79%     28.03s 99.93%  net/http.(*conn).serve
         0     0% 99.79%     28.03s 99.93%  net/http.HandlerFunc.ServeHTTP
0 0% 99.79% 28.03s 99.93% net/http.serverHandler.ServeHTTP可以看到,执行top后可以看出,程序有99%的时间都在执行main.loop函数。
执行list main.loop显示函数信息后,可以看出当前函数是一个死循环:
(pprof) list main.loop
Total: 28.05s
ROUTINE ======================== main.loop in D:\goworkspace\examples\learnpprof\main.go
    27.99s     28.03s (flat, cum) 99.93% of Total
         .          .     13:func loop(writer http.ResponseWriter, request *http.Request) {
         .          .     14:   i := 0
    27.80s     27.84s     15:   for {
         .          .     16:           i++
         .          .     17:   }
. . 18:}当然,我们也可以执行web指令通过图形化的方式形象地看出当前CPU的瓶颈所在:

从图中可以看到,颜色最深最大的为loop函数,它占用了绝大多数CPU。
火焰图分析
火焰图是软件分析中用于特征和性能分析的利器,因其形状和颜色像火焰而得名。火焰图可以快速准确地识别出最频繁使用的代码路径,从而得知程序的瓶颈所在。在Go 1.11之后,火焰图已经内置到了pprof分析工具中,用于分析堆内存与CPU的使用情况。
package main

import (
	"fmt"
	"log"
	"net/http"
	_ "net/http/pprof"
)

func main() {
	go func() {
		log.Println(http.ListenAndServe(":8000", nil))
	}()

	// 占用 cpu
	for {
		fmt.Println("hello")
	}
}可以简单地通过pprof工具查看火焰图。其中,-http表示开启pprof内置的http服务器,:8001代表监听的IP地址与端口:
$ go tool pprof -http :8001 http://127.0.0.1:8000/debug/pprof/profile?seconds=30在收集程序30s的CPU信息后,对应的web页面会自动打开。web页面的最上方为导航栏,可以查看之前提到的许多pprof分析指标,点击导航栏中的VIEW菜单下的Flame Graph选项,可以切换到火焰图,如下图所示:
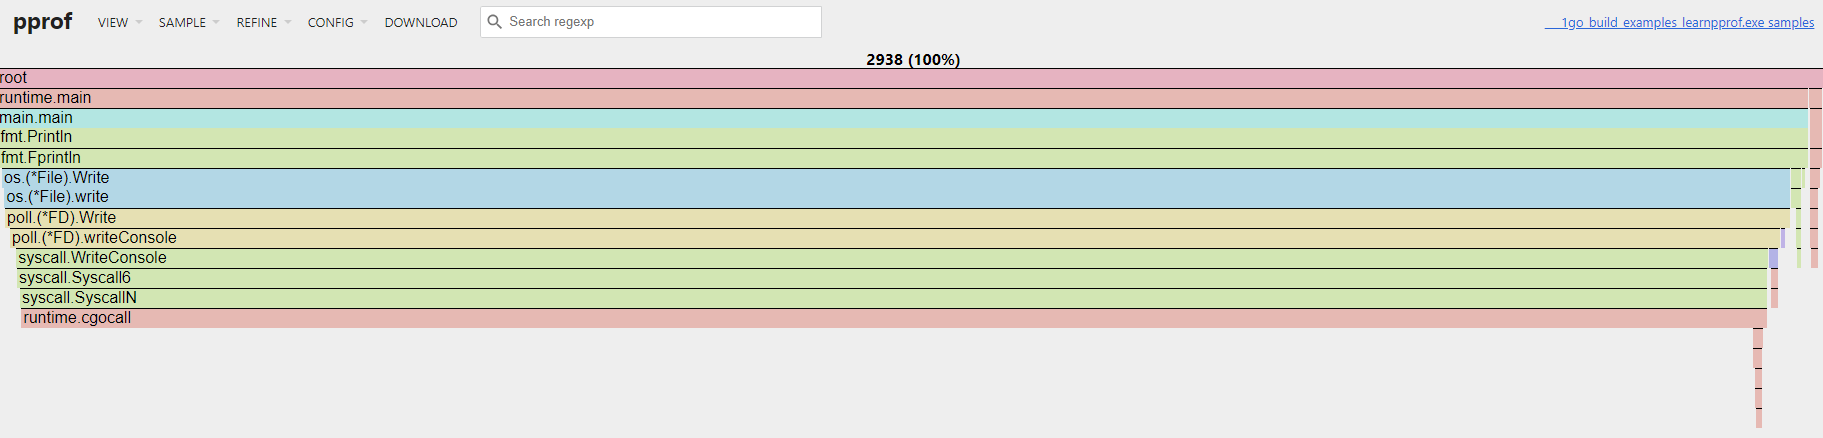
以CPU火焰图为例说明如下:

Golang控制协程(goroutine)的并发数量
4/17/2025减小Go代码编译后的二进制体积
4/17/2025
Rust Match全模式列表
1/9/2025
Redis哨兵细节分析
12/12/2024